
By: Mai Do, a Political Science major.
The following work was created for POL 401: Empirical Research Methods.
There are myriad influences on voter turnout: education, party identification, income. As American society changes over time, this list only grows. Decades of surveying Americans has revealed some patterns in Americans’ voting behaviors, but societal, cultural, economic, and political shifts have also impacted how and whether voters cast their ballots. From an individual psychological lens, an individual person’s likelihood of voting is a function of social location, psychological dispositions, the procedures involved in voting, and possible political events that occur at the time of each election.[1] Essentially, a variety of both external and internal factors motivate a citizen to vote or dissuade them from doing so.
Although there is a plethora of literature on voter turnout as both an individual and as a more collective, nationwide phenomenon, there is less interest in the impacts of different factors in statewide populations that might influence statewide voter turnout in presidential elections despite the common wisdom that each state is host to its own political culture, demographic makeup, and electoral issues. Without a more localized approach, the impact of social influences on voting are also overlooked.[2] In this analysis, I examined the impact of conservatism, union membership, age, urbanization, and education in statewide populations on voter turnout. Using the States data set—compiled by Philip H. Pollock III from various sources such as Americans United for Life, the Brady Campaign, Gallup, the National Conference of State Legislatures, and the U.S. Census Bureau—and SPSS, I examined the relationship between each of the aforementioned variables and statewide voter turnout in either 2008 or 2012, depending on the year the data for each independent variable was collected.
Hypotheses
Hypothesis 1: States with a conservative advantage in the mass public were more likely to have a higher turnout of the eligible voting population in 2012.
Conservatives, particularly registered Republicans, are often the most reliable voters among the American population. Republicans often lead in voter engagement, which eventually manifests itself at the ballot box.[3] Even poor weather has been shown not to deter the Republican vote and benefit the Republican Party’s vote share in presidential elections.[4] Given that conservatives are typically more likely to vote, I hypothesized that states with a conservative advantage in the mass public—coded in variable conserve_advantage—were more likely to have a higher turnout of the eligible voting population in 2012.
Hypothesis 2: States with higher percentages of workers who were unionized in 2007 were more likely to have higher turnout of the eligible voting population in 2008.
Although popular media characterizes unions as in continuous decline, existing literature suggests that union members, as voluntary members of an association, are more likely to be civically engaged than non-union members due to the organizational, participatory nature of the average union.[5] In fact, they are about 12 percent more likely to vote than non-union members and non-union people in union households are somewhat more likely to vote than those in non-union households.[6] Despite the decline of unions in the twenty-first century, the social, economic, and political environment produced by the presence of union members and their tendency toward civic engagement likely remains an influence on political culture. Therefore, I hypothesized that states with higher percentages of unionized workers in 2007 were more likely to experience higher turnout in 2008.
Hypothesis 3: States with higher percentages of people aged 18-24 in 2010 were more likely to have lower turnout of the eligible voting population in 2012.
Although the 2018 general election has brought about much enthusiasm among younger voters, young Americans have traditionally been the least likely age demographic to vote. Regardless of election year, voters between the ages of 18 to 24 have voted at rates up to 20% less than the next age group up.[7] Youth voter turnout has also declined by multiple measures over time since 1972—the year citizens aged 18 to 21 were first permitted to vote.[8] Since younger voters are generally less likely to vote, I hypothesized that the more voters between the ages of 18 to 24 there were in a state in 2010, the more likely the state would have lower turnout in 2012.
Hypothesis 4: States with higher percentages of urban populations were more likely to have a higher turnout of the eligible voting population.
Barriers to transportation, although not the most common obstacle to voting, are cited as one reason voters sometimes do not make it to the polls. When asked why they did not vote in the 2016 general election, 3% of respondents to a Pew survey indicated that transportation problems were the main reason they were unable to vote.[9] However, some research suggests that urban turnout has been in decline since Progressive Era reforms that gutted the urban party machines instrumental to much of voter activity.[10] While the results are mixed and studies about the issue are scarce, more and more cities are opting to make public transit free on Election Day with hopes that the increased ease of traveling to polling locations will encourage voters to turn out.[11] Since urban areas typically have larger and more developed transit systems, are generally denser, and often include more walkable neighborhoods, I hypothesized that states with higher percentages of urban populations were more likely to have a higher turnout of the eligible voting population in 2012.
Hypothesis 5: State populations with higher percentages of college-educated residents are more likely to experience higher voter turnout in 2012.
Researchers have continuously found that the more educated an individual is, the more likely that person is to vote. While an additional year or two of schooling often does not effect a person’s likelihood of voting, whether they matriculate typically does.[12] In fact, even externally influenced changes to high school graduation rates have significantly impacted voter turnout rates in surrounding areas.[13] Although simply attending classes might not be directly related with a person’s likelihood of voting, previous research has suggested that being enrolled in higher levels of education often exposes students to more political information and increases students’ levels of political knowledge – which is usually a more decisive factor in whether they cast their ballots.[14]
Data Analysis
Because several of the variables included in the States dataset are interval variables with fifty data points each, I recoded the independent variables using visual binning into terciles for ease of processing and visualization.
Hypothesis 1: States with a conservative advantage in the mass public were more likely to have a higher turnout of the eligible voting population in 2012.

Interestingly, in this case, the data do not support my hypothesis. Contrary to the assertion presented in Hypothesis 1, the above graph demonstrates a negative relationship between a state’s conservative advantage in the mass public and the mean turnout of the eligible voting population. The caveat with this particular analysis of conservatism and turnout is the inability—with this specific dataset—to account for the effect rural areas might have if added as a controlled variable.
Hypothesis 2: States with higher percentages of workers who were unionized in 2007 were more likely to have higher turnout of the eligible voting population in 2008.
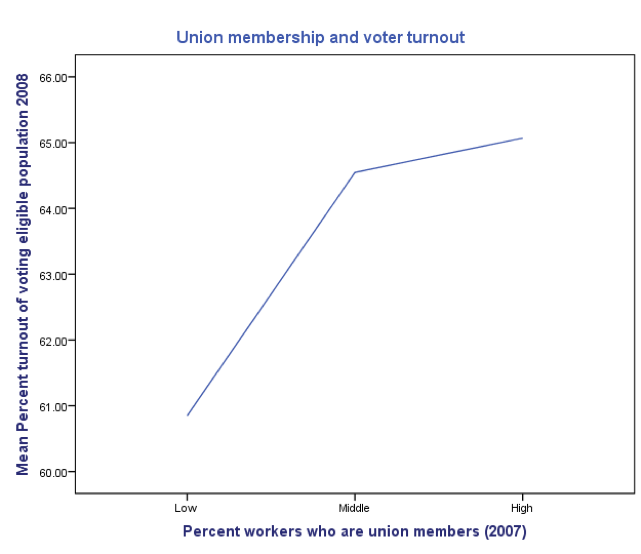
The above graph demonstrates that states with higher percentages of unionized workers in 2007 were more likely to have higher voter turnout in the 2008 general election, providing support for Hypothesis 2. It should be noted, however, that some literature suggests that because of an enduring relationship between labor movements and left-leaning policies, union members are more likely to be Democrats.[15] Given that the 2008 general election was the election in which Barack Obama won the presidency and that 2008 was the year of a financial crisis, if a dataset on union membership were available, further, controlled analysis might reveal the Democratic leanings of union members to have influenced the increased likelihood of union members voting in the 2008 election.
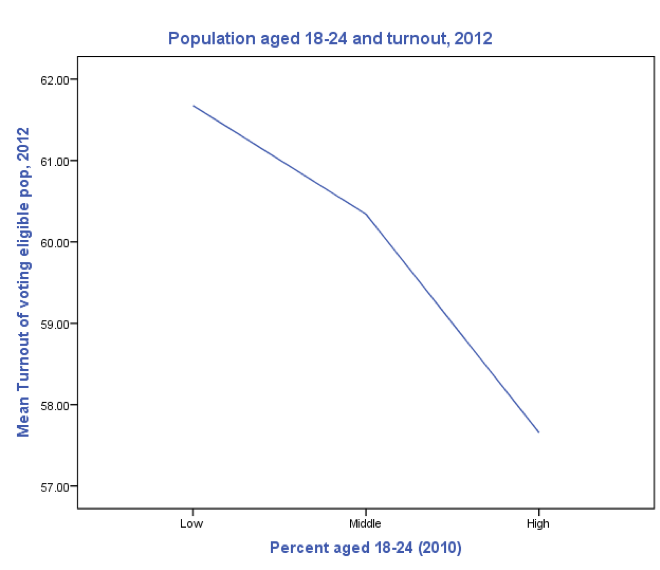
The above graph clearly demonstrates a negative relationship between the percentage of the population aged 18 to 24 and the turnout of the eligible voting population. The higher the percentage of people aged 18 to 24 in a state’s population, the more likely the mean turnout of the voting eligible population for that state was lower—up to four percentage points. Although the data illustrated does support the hypothesis that states with higher percentages of people aged 18-24 in 2010 were more likely to have lower turnout of the eligible voting population in 2012, the negative relationship illustrated here appears to be much weaker than I originally anticipated. However, four percentage points potential difference for such a small segment of the population does affirm the age demographic’s impact—or lack thereof—on overall turnout.
Hypothesis 4: States with higher percentages of urban populations were more likely to have a higher turnout of the eligible voting population from 2000 to 2012.

The
above graph demonstrates a spurious relationship between the percentage of a
state’s population being in urban areas and voter turnout. There appears to be
no clear positive or negative relationship between the two variables. The data
in this case do not support the hypothesis that urban areas would experience
higher voter turnout in 2012. This aligns with much of the scholarship on urban
voter turnout, which suggests that urban populations are not necessarily more
likely to vote despite increased ease of transportation.
Hypothesis 5: State populations with higher percentages of college-educated residents are more likely to experience higher voter turnout in 2012.
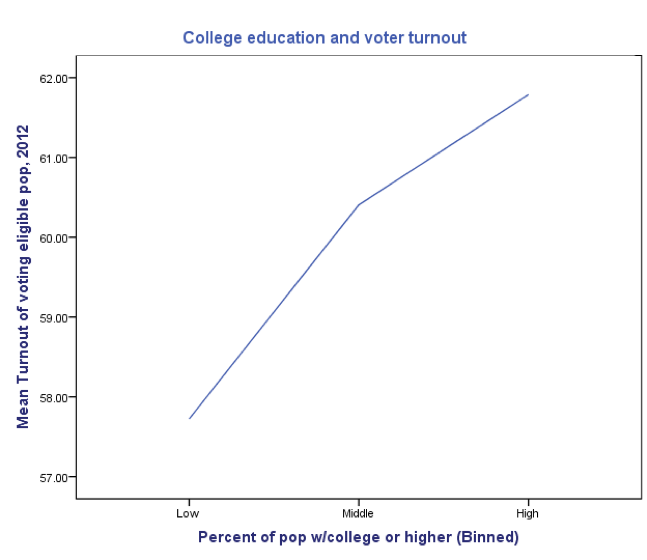
Unsurprisingly, the data does support the hypothesis that state
populations with more college-educated residents are more likely to experience
higher voter turnout. There is an increase in turnout of about two percentage
points with each increase in the percentage of a state’s population that has
college education, as illustrated in the above line graph.
Conclusion
This analysis attempts to examine the impact of collective and social influences on voting by analyzing the influence of statewide factors on turnout. I found that conservatism, union membership, age, and education in statewide populations had clear impacts on voter turnout in the 2008 and 2012 elections, but the percentage of urban areas in states did not. These findings mostly aligned with what previous scholars have found regarding each independent variable, although further analysis or research must be done to better explain the negative relationship between mass conservative advantage and turnout given the relationship’s contrast to decades of research on American conservatives’ voting behavior.
Most interesting out of these five findings was the positive relationship between the percentage of union members in a state’s population and the state’s voter turnout. Because union membership has been in decline, the electoral influence of unions has been increasingly dismissed as negligible. Despite the decreased explicit political power of unions – most recent and notable of events demonstrating this being the Janus v. AFCME Supreme Court decision – the positive relationship between the percentage of unionized workers in a state and turnout demonstrates that unions still hold an enduring influence on political culture. The finding that characteristics of a population influences voter turnout perhaps characterizes this report in general; despite the influence of socioeconomic demographics and political issues on turnout, the profound societal impacts on turnout ought not to be neglected.
Bibliography
Burden, Barry C. “The Dynamic Effects of Education on Voter Turnout,” Electoral Studies 28 (2009), 540-549.
Dark, Taylor E. The Unions and the Democrats: An Enduring Alliance. Cornell University Press (2001).
File, Thom. “Young-Adult Voting: An Analysis of Presidential Elections, 1964-2012,” United States Census Bureau (2014).
Freeman, Richard B. “What Do Unions Do… to Voting?” National Bureau of Economic Research (2003).
Gerber, Alan S. “Social Pressures and Voter Turnout: Evidence for a Large-Scale Field Experiment,” American Political Science Review 102 no. 1 (2008), 33-48.
Gomez, Brad T. et al. “The Republicans Should Pray for Rain: Weather, Turnout, and Voting in U.S,” The Journal of Politics 69 no. 3 (2007), 649-663.
“GOP Has Midterm Engagement Advantage,” Pew Research Center, Jul 24 2014.
Harder, Joshua and Jon A. Krosnick. “Why Do People Vote? A Psychological Analysis of the Causes of Voter Turnout,” Journal of Social Issues 64 no. 3 (2008), 525-549.
Juravich, Tom and Peter R. Shergold, “The Impact of Unions on the Voting Behavior of Their Members,” ILR Review 41 no. 3 (1988), 374-385.
Levine, Peter and Mark Hugo Lopez, “Voter Turnout Has Declined, by Any Measure,” The Center for Information & Research on Civic Learning and Engagement at the University of Maryland’s School of Public Affairs (2002).
Lopez, Gustavo and Antonio Flores. “Dislike of candidates or campaign issues was most common reason for not voting in 2016.” Pew Research Center. Jun 1, 2017.
Neal Caren, Neal. “Big City, Big Turnout? Electoral Participation in American Cities,” Journal of Urban Affairs 29 no. 1 (2007), 31-46, DOI: 10.1111/j.1467-9906.2007.00321.x
Sondheimer, Rachel M. and Donald P. Green, “Using Experiments to Estimate the Effects of Education on Voter Turnout,” American Journal of Political Science 54 no. 1 (J2010), 174-189.
Sturgis, Sam. “Could Free Public Transit Get Americans to Voting Booths?” CityLab. Nov 3, 2014.
Tenn, Steven. “The Effect of Education on
Voter Turnout,” Political Analysis 15
no. 4 (2007), 446-464.
Appendix A: Variables
Note: Several variables used in this analysis were recoded using visual binning into terciles for ease of processing and visualization.
college (recoded into terciles): The college variable included data on the percentage of each state’s population that completed undergraduate education, which was then recoded into terciles.
conserve_advantage (recoded into terciles): The original conserve_advantage variable included nineteen columns of values indicating how much of a conservative advantage was present in the mass public in each state in 2012, from a value of -2.20 to 36.00. The conserve_advantage variable was then recoded into terciles: low conservative advantage, middle (medium) conservative advantage, and high conservative advantage.
pop_18_24_2010 (recoded into terciles): This variable included values that indicated the percentage of each state’s population that was between the age of 18 to 24. The variable was then recoded into terciles: low population aged 18 to 24, middle (medium) population aged 18 to 24, and high population aged 18 to 24.
union07 (recoded into terciles): The union07 variable includes values for the percent of workers who were union members in each state in 2007, which was then recoded into terciles: low, medium, and high percentage of unionized workers.
urban (recoded into terciles): The urban variable includes values for the percent of residents living in urban areas in each state, which was then recoded into terciles.
vep12_turnout: The vep12_turnout variable includes the percent turnout of the voting eligible population in 2012 for all fifty states, totaling fifty values.
vep08_turnout: The vep08_turnout variable includes the percent turnout of the voting eligible population in 2008 for all fifty states, totaling fifty values.
Appendix B: Compared Means
| Compared means of vep08_turnout and conserve_advantage (binned) | |||
| Turnout of voting eligible pop, 2012 | |||
| Conservative advantage, mass public (2012) (Binned) | Mean | N | Std. Deviation |
| Low | 61.9882 | 17 | 7.11590 |
| Middle | 61.0882 | 17 | 6.46750 |
| High | 56.5313 | 16 | 4.70570 |
| Total | 59.9360 | 50 | 6.53286 |
| Compared means of vep08_turnout and union07 (binned) | |||
| Percent turnout of voting eligible population 2008 | |||
| Percent workers who are union members (2007) (Binned) | Mean | N | Std. Deviation |
| Low | 60.8471 | 17 | 4.59417 |
| Middle | 64.5471 | 17 | 5.78177 |
| High | 65.0688 | 16 | 6.32642 |
| Total | 63.4560 | 50 | 5.80373 |
| Compared means of vep12_turnout and pop_18_24_2010 (binned) | |||
| Turnout of voting eligible pop, 2012 | |||
| Percent aged 18-24 (2010) (Binned) | Mean | N | Std. Deviation |
| Low | 61.6765 | 17 | 8.51958 |
| Middle | 60.3412 | 17 | 5.54561 |
| High | 57.6563 | 16 | 4.47511 |
| Total | 59.9360 | 50 | 6.53286 |
| Compared means of vep12_turnout and college (binned) | |||
| Turnout of voting eligible pop, 2012 | |||
| Percent of pop w/college or higher (Binned) | Mean | N | Std. Deviation |
| Low | 57.7235 | 17 | 6.80042 |
| Middle | 60.4059 | 17 | 4.54952 |
| High | 61.7875 | 16 | 7.65209 |
| Total | 59.9360 | 50 | 6.53286 |
| Compared means of vep12_turnout and urban (binned) | |||
| Turnout of voting eligible pop, 2012 | |||
| Percent urban population (Binned) | Mean | N | Std. Deviation |
| Low | 59.0176 | 17 | 6.93544 |
| Middle | 62.1000 | 17 | 5.60446 |
| High | 58.6125 | 16 | 6.81712 |
| Total | 59.9360 | 50 | 6.53286 |
[1] Joshua Harder and Jon A. Krosnick, “Why Do People Vote? A Psychological Analysis of the Causes of Voter Turnout,” Journal of Social Issues 64 no. 3 (2008), 525-549.
[2] Alan S. Gerber, “Social Pressures and Voter Turnout: Evidence for a Large-Scale Field Experiment,” American Political Science Review 102 no. 1 (2008), 33-48.
[3] “GOP Has Midterm Engagement Advantage,” Pew Research Center, Jul 24 2014.
[4] Brad T. Gomez et al. “The Republicans Should Pray for Rain: Weather, Turnout, and Voting in U.S. Presidential Elections,” The Journal of Politics 69 no. 3 (2007), 649-663.
[5] Tom Juravich and Peter R. Shergold, “The Impact of Unions on the Voting Behavior of Their Members,” ILR Review 41 no. 3 (1988), 374-385.
[6] Richard B. Freeman, “What Do Unions Do… to Voting?” National Bureau of Economic Research (2003).
[7] Thom File, “Young-Adult Voting: An Analysis of Presidential Elections, 1964-2012,” United States Census Bureau (2014).
[8] Peter Levine and Mark Hugo Lopez, “Voter Turnout Has Declined, by Any Measure,” The Center for Information & Research on Civic Learning and Engagement at the University of Maryland’s School of Public Affairs (2002).
[9] Gustavo Lopez and Antonio Flores. “Dislike of candidates or campaign issues was most common reason for not voting in 2016.” Pew Research Center. Jun 1, 2017.
[10] Neal Caren, “Big City, Big Turnout? Electoral Participation in American Cities,” Journal of Urban Affairs 29 no. 1 (2007), 31-46, DOI: 10.1111/j.1467-9906.2007.00321.x
[11] Sam Sturgis. “Could Free Public Transit Get Americans to Voting Booths?” CityLab. Nov 3, 2014.
[12] Steven Tenn, “The Effect of Education on Voter Turnout,” Political Analysis 15 no. 4 (2007), 446-464.
[13] Rachel M. Sondheimer and Donald P. Green, “Using Experiments to Estimate the Effects of Education on Voter Turnout,” American Journal of Political Science 54 no. 1 (J2010), 174-189.
[14] Barry C. Burden, “The Dynamic Effects of Education on Voter Turnout,” Electoral Studies 28 (2009), 540-549.
[15] Taylor E. Dark, The Unions and the Democrats: An Enduring Alliance. Cornell University Press (2001).
